

Solana climbed to $125, but whale exits and dense supply zones near $140 raised the risk of a long squeeze.
The recent bounce looked more like a temporary relief rally.
Despite Solana’s[SOL] recent recovery to $120, large holders remain deep in the red, which affects the overall market sentiment.
On-chain data shows a major whale recently liquidated 274,188 SOL at an average price of $108. With an initial cost basis of $148, this capitulation locked in a staggering $11 million in realized losses.
Even with SOL now hovering around $125, marking a 30% bounce from its April 7 low of $95, the whale would still be underwater.
This behavior reflects continued distribution among smart money, as whales use liquidity spikes to exit rather than accumulate. For retail traders, it’s a caution flag amid a fragile macro and on-chain backdrop.
Key supply zone in focus
The UTXO Realized Price Distribution (URPD) provides a granular breakdown of where Solana coins were last transacted and mapped against price levels.
For SOL, the data highlights three major supply clusters – around $100, $120, and $140. These concentrations indicate that a significant share of the circulating supply was acquired at these levels.
Among them, the $140 zone stands out, with over 27.8 million SOL concentrated there, accounting for approximately 4.75% of the total circulating supply.
This cluster represents a key area of resistance, as many holders are either near breakeven or facing unrealized losses.

Source: Glassnode
Therefore, the risk of whale-driven sell-offs remains if SOL fails to reclaim the $140 level. A price move back to this threshold could lead to holders shifting into unrealized profits, potentially triggering a bullish rotation driven by FOMO and market greed.
Additionally, 38 million SOL remain clustered between $117 and $120, making this range a potential hotspot for profit-taking as price breaks this ceiling.
As a result, until the $140 level is tested, price volatility in Solana’s price action is likely to persist.
Futures data reinforces Solana’s market outlook
Solana’s 7.07% daily upswing positions it as the leading top-tier asset in terms of recovery velocity.
This rally isn’t just spot-driven — Derivatives data confirms aggressive positioning. Open Interest (OI) jumped 13.89% to $5.23 billion, signaling a fresh wave of leveraged exposure entering the market.
At first glance, this appears bullish. However, it also introduces fragility.
The whale distribution was still active, and Short-Term Holders (3–6 months) are still deep in the capitulation zone. Plus, the recent breach of a high-density supply zone ($117–$120) sets the stage for elevated liquidation risk.
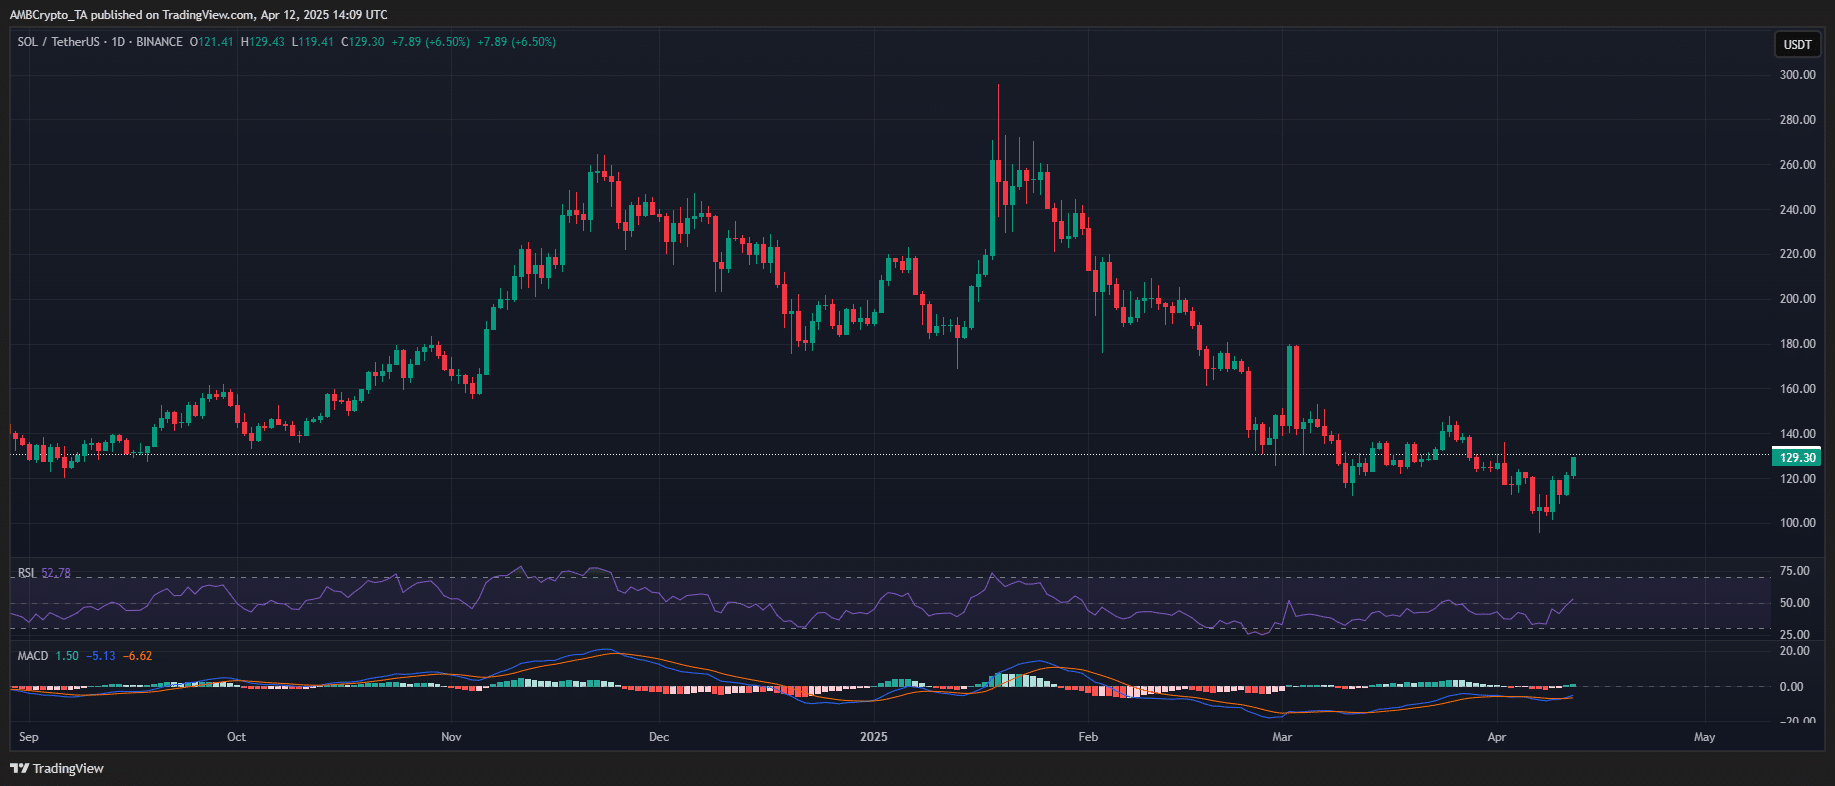

Source: TradingView (SOL/USDT)
Should Solana fail to sustain momentum, a cascading long squeeze could trigger sharp downside volatility, particularly as funding rates start skewing positive.
In short, while the recent bounce has sparked optimism, this rally bears hallmarks of a liquidity-driven relief phase—not a confirmed trend reversal.
Until Solana reclaims and holds above the $140 supply zone with conviction, downside risk remains firmly on the table.